

Using Lucky Orange to Visually Analyze Your Ecom Store’s Data

It’s human nature to observe, analyze data, and draw conclusions. No doubt the ancient peoples of the world observed bird migration and anticipated a change of season just as we look at dark clouds and predict rain.
Ecommerce store owners are doing the same when collecting and analyzing data to learn more about the behavior of store visitors. Once you collect and analyze behavioral data, you can use it to improve many aspects of your ecommerce store, create a better user experience, and improve conversions.
Lucky Orange (LO) is one behavioral analytics tool we use every day. Here we’ll talk about the different types of data you can gather with LO session recordings and heatmaps as well as how to use that information to guide changes to your ecommerce store.
Use Session Recordings to Gather Data
With LO session recordings, you can visually observe multiple user sessions that capture the user’s journey—including mouse use, elements visitors click to navigate from page to page, and where they might be bouncing from your ecom store. This powerful data can help you take relevant actions to improve your business operations with these sorts of analyses:
- Assess search terms: By reviewing session recordings where visitors use search terms to navigate, you can determine if the terms used are producing results. If they aren’t, you can take the terms visitors are using and add those to product tags to help them more easily find products in your store.
- Identify 404 errors: Recordings can show you where users are landing on 404 pages. You can identify exactly where and what they clicked to get to an error page. This gives you the information you need to fix the problem.
- Identify coupon errors: Sometimes customers have issues with coupons (e.g., they don’t work) and contact your customer support. By consulting the recordings you can see why the coupon wasn’t applicable, what the user did wrong, or sometimes that the user encountered a technical problem (e.g., closed the after-sale coupon pop-up and then weren’t able to reopen it). With any of these discoveries, you now know the problem so that you can fix them and/or to provide customer support with information that will help them answer potential customers’ questions.
- Detect user-experience errors: When you see user errors in the recordings, you can track exactly what users did (e.g., what they clicked or failed to click) to pinpoint bugs and/or ways to make a desired action easier for users to understand.
- Detect layout issues: You can also identify layout issues related to media sizes. For example, sometimes banners or newsletter pop-ups designed for one view are awkward to use in another. Once you identify such issues in the user recordings, you can fix them.
Use Heatmaps to Gather Data
LO heatmaps provide the ideal way to learn what areas of your store are attracting visitors’ attention, what areas are confusing or distracting them, or maybe what visitors are completely missing! LO offers several types of heatmaps: click, move, and scroll maps.
Click maps
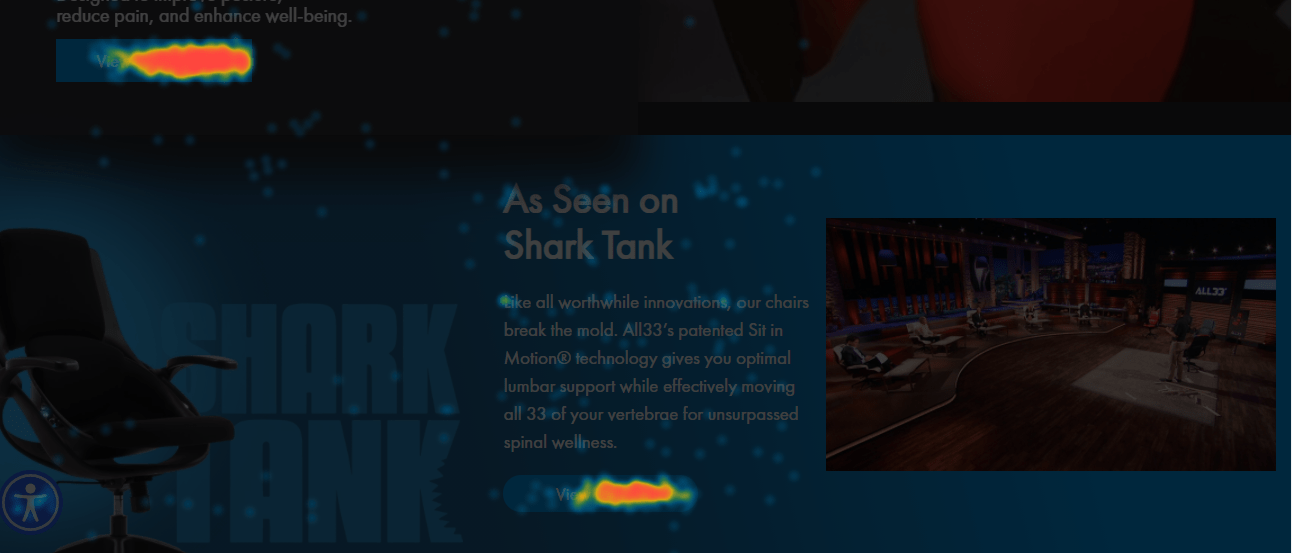
Heatmap data for All33, a store that sells comfortable work chairs
Click maps have three display colors to indicate levels of activity: reddish-orange for hot areas that get the most activity, bright orange for warm areas, and a bluish color for cold areas. Although this depends somewhat on the design of the ecommerce page you’re analyzing, you’ll find that most hot areas usually contain buttons, links, or images that motivate customers to take action.
Tip: If your click-map data shows that button and link areas are not hot, it’s possible users aren’t interacting with your click-to-action options because they have little or no motivation to do so, which, in turn, leads to fewer conversions. If that’s the case, you’ll want to review your store’s design to determine why your buttons, links, and the like are not motivating visitors.
Move maps

Move-map data for All33
Move-map data reveals the places where users frequently move or hover the mouse, indicating the areas in the store that interest them. They help map out hot, warm, and cold areas of each page.
For example, you might notice that some people move a cursor along lines of text while reading them. This is one indication that users are reading rather than just skimming the text.
Move maps also show “empty” areas with no cursor activity. Note that users may leave the cursor in one area and choose to scroll by using the up and down arrow keys or the scroll bar. For this reason, it’s best not to rely on one heatmap for a full understanding of how the screen is used. For example, a scroll map could help show what is happening in this area as could watching session recordings of users on this page.
Scroll maps

Scroll-map data for All33 showing 50% effective fold
Scroll maps show how far down the page users scroll, always indicating the percentage of people who reach a given point since not all users scroll to the bottom of the page. That gives you a sense of the area of the page in which users are getting the most value, typically the top 50% of the page. The line at which users most often stop scrolling is often referred to as the effective fold.
What Heatmaps Can Tell You
You can use Lucky Orange heatmap data to understand a variety of elements of your store’s user experience:
- Identify the most-clicked elements: For example, using a click map on the homepage you find that users aren’t clicking the header banner. Instead, they’re scrolling all the way down the page to click on one of your best-selling products. This suggests that you should create a banner that represents that best-selling product. This would reduce users’ scrolling journey by giving them what they want as soon as they visit your store.
- Identify bugs: Using click maps, identify elements that look like links or click-to-action buttons but aren’t links or buttons. You can either add links to these elements or change their appearance so they no longer look clickable. Either way, you are saving your visitors from some friction.
- Locate the effective fold: Using scroll maps, identify the effective fold (typically halfway down the page). This shows you the area of the page where you need to include important information, including click-to-action buttons, so that most visitors will see them. If there are elements that matter and are below that fold, you should move them up.
- Determine areas of the page that draw visitors’ attention: Using move maps, locate the hot, warm, and cold areas of the page. You can use this information when doing a redesign to determine which elements go where for the most effective results.
- Collect user-experience usability data: Using click maps, view session recordings to see what users clicked on and to analyze what their intent may have been. For instance, you may notice that a user scrolls up and down a product page and clicks on two different size charts that contain different information. This suggests that you might want to combine the two size charts to improve usability for visitors.
- Determine how to restructure the navigation: Using click maps can help you identify when users don’t click on a main category but do end up clicking on a subcategory that may have been hidden behind a drop-down menu. This indicates that customers want to see the subcategory options as main options—at first glance—without having to take an intermediate action like clicking the drop-down arrow to see the subcategories.
Testing the Data
Once you have all of this valuable information, it’s essential that you test all potential changes before you adopt them. You have these testing options:
- Run A/B split tests to test whether your new ideas have a positive impact on your ecom store. In a split test, 50% of your store’s traffic is routed to a revised page while 50% visit the unchanged page. By comparing the results, you can decide if you want to make an official change. Note: Learn more here about how to run A/B split tests and mistakes to avoid.
- You can also test any usability issues you’ve discovered by running tests where users perform tasks while talking about and recording the experience. This can help you to prove your hypothesis. Note: Learn more about how to run a successful user test here.
Conclusion
The ecommerce store session recordings and heatmap data you can gather from Lucky Orange are so important. Your ecom store can really benefit from your study of this data. Using the data can open up so many opportunities for improving user experience on your ecom store, hopefully to the degree that you make the buyer’s journey easy, fun, efficient, and effective.
Resources
Bowman, A. (2018). CRO-ology: Dynamic heatmaps. Lucky Orange blog.


About the author
Irene Wanja
Irene, a skilled Revenue Optimization Specialist for Build Grow Scale, combines an unparalleled focus on user research and a deep understanding of the ecommerce customer journey to orchestrate optimal shopping experiences. With an uncanny knack for detecting and addressing customer pain points through meticulous user testing, she utilizes tools such as moderated user tests, heatmaps, scrollmaps, and clickmaps to fast-track improvements in user experience and usability. Her keen eye for detail aids in swiftly spotting potential issues and implementing solutions, all while working closely with store owners and applying her intricate comprehension of user interactions. Passionate about software and technology, Irene immerses herself in enhancing her clients' business clarity, efficiency, and user satisfaction. Even though the value of user experience doesn't conform to a conventional numerical scale, the tangible outcomes of her work—improved user experience, amplified retention rates, and reduced customer support issues—are testaments to her prowess. Beyond her revenue optimization skills, Irene is a skilled writer and copywriter. She weaves her profound insights into engaging prose, crafting content that not only resonates with diverse audiences but also demystifies the complexities of user experience, consequently benefitting businesses worldwide.