

Google Analytics Key Metrics: Which Page of Your Ecom Store to Focus On
Hey, this is Brad with BGS. I’m a Revenue Optimization™ expert, coach, and instructor with Ecommerce Business Blueprint, which is our beginner’s course.
In this video, I’m going to talk about Google Analytics, everybody’s favorite subject, and really how to analyze it and focus on what pages to optimize.
First, we’re going to go over some of the data and benchmarks we use and then we’re actually going to go into Google Analytics on a real store and I’ll show you how to analyze the report.
So, as a Revenue Optimization specialist, a lot of times we ask ourselves “What page do I optimize first?” Well, we used Google Analytics shopping behavior analysis to laser focus on which pages could use optimization. And to do this, we used benchmarks to determine what to work on first.
For the homepage, we want the following:
- No more than 30% drop-off from the homepage to either category or product page.
- On the product page, no more than 80% drop-off from the product page to the cart or the cart page.
- From the cart page, no more than 40% drop-off from the cart to check out.
- On the checkout page, no more than 40% drop-off from checkout to a transaction.
Now let’s look at a real example in Google Analytics.
OK, so we’re on Google Analytics. This is a home screen. This is a store that’s kind of dormant right now, but we can look at some historical data and we’ll go over it. And I wish I knew this a couple years ago because I was always scared of Google Analytics because it’s very intimidating to me. But it doesn’t have to be.
So, over here on the left we’ve got our menus, you’ve got the home screen. I’m going to go down to “Conversions” and click “Ecommerce” … Then I’ll click “Shopping Behavior.”
Now, if you do not see this screen, that means you do not have it set up yet. So, there will be a button and you push that. You just select the button to set it up, and it walks you through. And it’s really easy to do.
I was able to do it very easily a couple years ago with knowing basically nothing about GA. Too bad I never used it. But now I know better, right?
So, we’re on our Shopping Behavior report and this is what we use, as ROs, to really laser focus on what page we want to optimize first, what pages we really need to work on. What you want to do over here … up at the top you have a date range, and you want to do at least two weeks. I’m going back to 2019 to get some real data, when I had my store live.
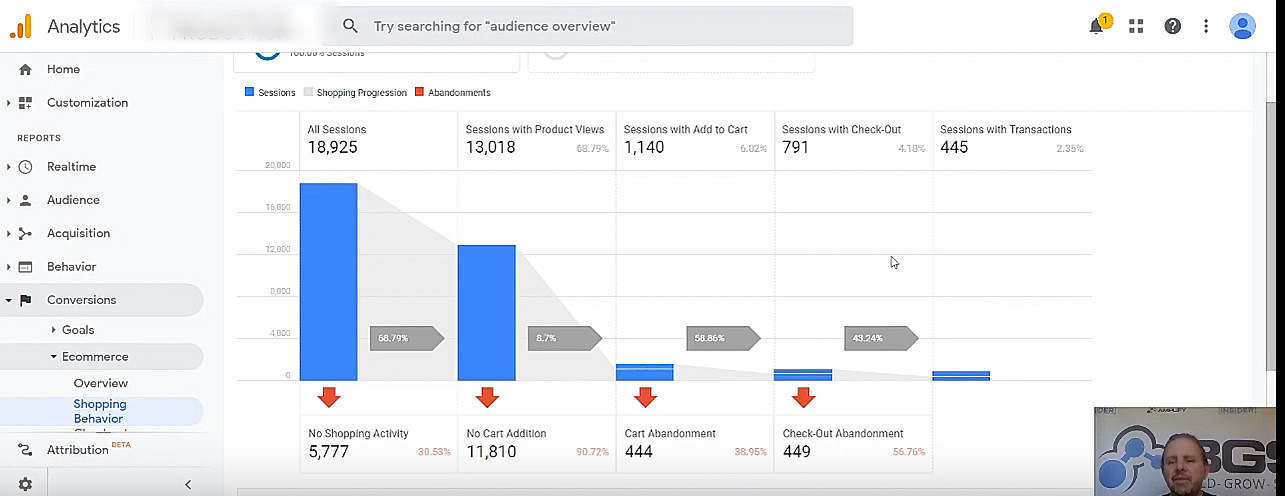
At the top here, these top columns and these numbers are your big overview numbers. So, within this date range I had almost 19,000 sessions, 13,000 with product views. You’ve got your percentages here, and these are going to be close to the percentages that you’re going to see in Shopify. So, if you look at your conversion rate in Shopify, it’s going to be close to this 2.35% number. If I look at my “Add to Cart,” it’s going to be close to the 6.02%. But these numbers are all based on this 18,925 total. Now, the benchmark metrics we’re looking at are based on this bottom number compared to this top number, basically. And that’s what we care about. We don’t care about the percentage from the total sessions; we’re looking at how much is dropping off from one stage to the next.
Over here, with “All Sessions,” we wanted no more than 70% drop-off. We’re at 30%, so we’re actually really good. And what this shows, too, is that we were driving traffic to product pages and not our homepage. If you’re driving traffic to your homepage, then it may be a lot higher. So, we’re good with our homepage right here.
Now, with our product views, we had 13,000 with product views, but 11,800 with no “Add to Cart.” We want no more than 80% drop-off; we had 90% drop-off here. So, we want about 20% with this number, which is a 20% “Add to Cart” range based on this 13,000 up here. We’re below that, so we can see that we need to work on our product pages.
The “Add to Cart” stage … We had 1,140 “Sessions with Add to Cart,” and then 444 that abandoned the cart. Which means that 791 actually went to checkout. We want no more than 40% abandonment; we’re at 38.95%, so our cart page was actually good. We’re right at that benchmark. That’s a good benchmark. Now, it never hurts to optimize further and test further, but that’s not a problem area—right now my problem area is on the product page.
Checkout … We had 791 “Sessions with Check-Out,” but we had 449 that abandoned. Again, we want no more than 40% and we’re at 56.76%. And this [gray arrow under “Sessions with Check-Out”] should be around 60 right here; that’s 43. So, this is another area that we can work on.
Now, with Shopify, you’re very limited with what you can do with checkout. There are a few things that you can change within Shopify, otherwise, you have to get Shopify Plus to really be able to edit your checkout page. But you do what you can, OK? So, on this site, we have our checkout page, which is a problem area, and then our product page.
You always want to start closer to the transactions. That’s the stage of the funnel that you want to start with if you have a problem area, so I would start with optimizing my checkout page and then run tests to it. After that I want to optimize my product view page—well, not my product view, but my product page. And that can also be your category page too, but I was sending traffic to my product page so that’s what I want to really focus on.
So, these are the two that I want to focus on, and this is really how you can determine what pages you need to work on: by using Google Analytics, by using the Shopping Behavior report, using the benchmarks.
Again, if you have really high-ticket items, if your product costs like $1,500, something like that … If it’s super expensive, then the benchmarks are going to be a lot different, a lot lower. You’re going to have lower conversion rates anyway, typically, because it’s going to be a more expensive item. But for the most part, if you’re doing the typical print-on-demand, drop shipping, things like that, these are going to be good metrics to use. And you want to use this Shopping Behavior report to really focus on what pages you need to work on next.
So, I hope this was helpful. And again, if you want to build, grow, or scale your business, make sure you go to www.workwithbgs.com and we can help you build, grow, or scale. OK, thanks a lot.


About the author
Brad Owens
Brad Owens is a BGS Revenue Optimization expert, instructor, and coach with Ecommerce Business Blueprint (EBB) and EBB Elite. He started working in ecommerce back when Amazon had auctions (hint: that was a long time ago!) and has extensive experience with marketplaces, stores, and retail—even owning a comic shop for eight years. A graduate of the Atlanta Institute of Music, he can sometimes be spotted around Atlanta playing guitar in his hard-rock disco band.