

Ecom Tip: Using GA to Improve Your Buyer’s Journey

According to Shopify, about 1.76% is the average ecommerce conversion rate. That means close to 98% of people are leaving your store without buying, usually because of something to do with your website’s user experience. The good news is you can improve that user experience with something called conversion rate optimization (CRO), or as we call it at BGS, Revenue Optimization™.
Improving people’s experience and the overall buying process on your store has a lot of steps to it, but there are ways you can chunk it out to make it easier.
Where to Find Drop-offs
First, we’re going to look at Google Analytics and talk about where you can find drop-offs, as well as some things you can do to discover what the problems could be. This will be more of a high-level overview, but I want to give you an idea of what to look for and make sure you’re looking at your data regularly so you know what people are doing on your site.
So, without further ado, let’s go ahead and jump into a Google Analytics (GA) account so I can share my screen and show you what this looks like. Below is a screenshot of one of our client’s GA performance data.
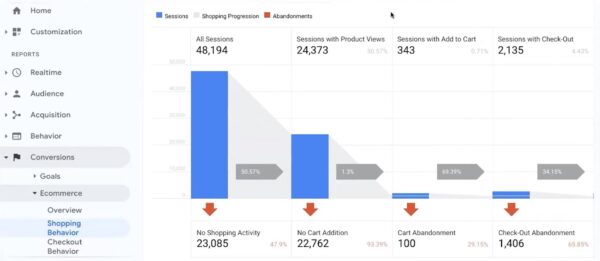
- All Sessions
- Sessions with Product Views
- Sessions with Add to Cart
- Sessions with Check-Out
- Sessions with Transactions
Generally, an acceptable average drop-off rate from the product page is about 80%. So, 80% of people will drop off your product page without adding to cart. From there, you’ll see a 40% drop-off from Add to Cart to Check-Out, and a 40% drop-off from Check-Out to Transaction. So, keep 80%, 40%, 40% in the back of your mind.
Product Page Drop-off
Now, you’ll notice this particular store has approximately a 93% drop-off from the product page (Product Views) to Add to Cart. That’s concerning, and it tells us that something on the product page is not resonating with their buyers. This particular store happens to have a higher priced product (over $400), which isn’t a fit for everybody, so that could be part of the issue here. However, if your store doesn’t have high prices, you need to ask yourself, “What can I fix on my product page to make this process better?”
Add-to-Cart Drop-off
From there, you move on to Add to Cart. If you see more than 40% abandonment from Add to Cart, that means something on your cart is scaring people off. Somehow, you’re not making it clear what they’re getting, whether that has to do with the price, their subtotal, lack of proof of concept or social proof, or maybe your shipping isn’t shown in your cart section. Whatever it is, you need to do your best to remove fears and objections at this step of the buyer journey.
Checkout Drop-off
There are three pages in the Check-Out Abandonment section (information, shipping, and payment), and one of those pages will likely have a higher drop-off than the other two. So, you’ll want to see what you can do to optimize things on that page. Unfortunately, with Shopify, unless you have a Shopify Plus account, there isn’t a whole lot you can do in the checkout section, but there are some things you can do.
When you’re analyzing this data and seeing drop-offs in the conversion rate, you want to make sure you’re checking these three sections to find out where people are dropping off.
So, like I mentioned earlier, if you’re seeing more than an 80% drop-off from the product page, or higher than 40% drop-off from Add to Cart or Check-Out, there’s something going on with that page that people aren’t resonating with and you want to see what you can do fix the page.
Now that you know how to analyze your GA data to find out where drop-offs are happening on your ecom store, you need to be able to identify the reason people are dropping off.
Why Drop-offs Are Happening
The first thing you can do is go to your site and see if there’s anything on the product page that isn’t acting the way it should.
Lucky Orange
My go-to tool for doing this is called Lucky Orange. It’s a screen-recording software that records the buyer’s journey, so you can watch several recordings from the product page and see what’s happening during their shopping journey that’s causing them to fall off.
You may see a bug of some sort; maybe someone’s clicking “Add to Cart” but the button isn’t actually adding the product to their cart. Or perhaps there’s another type of user experience issue that isn’t ideal. Whatever the case, Lucky Orange will give you really good insight into what’s happening on your store so you can dial things in on whatever page is seeing higher-than-average abandonment.
User Testing
The second thing you can do is called user testing. With this, you hire people to navigate through your store (like they would if they were shopping) and record their experience to see if there’s anything they don’t like. I recommend doing this with at least 10 people so you can get a solid sample of opinions to help you figure out what improvements are needed to streamline the buyer’s journey.
Google Analytics: Behavior
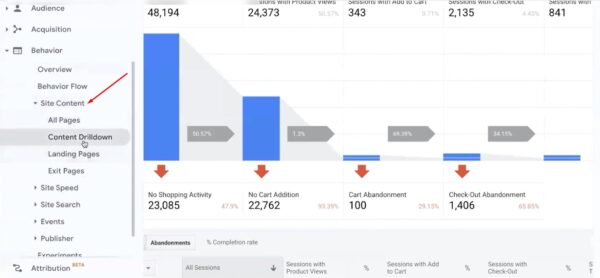
A third option, if you feel like diving into the data, is to go to the Behavior section in your Google Analytics, start with “Site Content,” and just go down the list (Site Speed, Site Search, Events, etc.) to figure out where people are exiting.
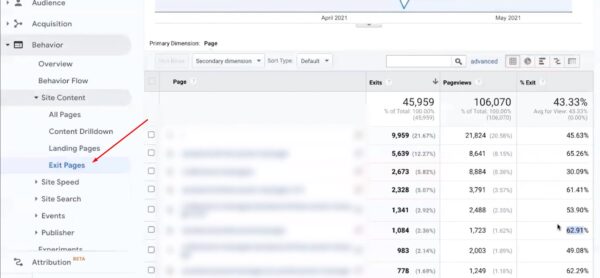
A good way to do this is to go to Landing Pages or Exit Pages and see what the average number of exits is. You’ll see that the average % Exit is 43.33% for this store (pink box below). Next, look for pages that are well above that average (green arrows below). For instance, here we have several that are markedly higher than the average:
- 65.26%
- 61.41%
- 62.91%
- 62.29%
It’ll be the same with Site Speed. If certain pages on your site are taking longer to load than others, look into those pages and see what you or a developer can do to help you speed them up. Just keep going down the Behavior section list to find out where you can make improvements to your website.
Quick Recap
- To find out where drop-offs are happening, dig into your Google Analytics data (Conversions > Ecommerce > Shopping Behavior).
- Use the software Lucky Orange to review user behavior and see if you can find any bugs or something that’s happening that shouldn’t be.
- Hire user testers to give you their honest feedback as they go through your store.
- Utilize data in the Behavior section of your Google Analytics to pinpoint pages on your store that need improvement.
Wrap-up
Whether you call it “conversion rate optimization,” “Revenue Optimization,” or something else, using the methods outlined in this article will help you dial in your store, increase your conversion rate, and make more money. Plain and simple. So, give everything we covered a try, and if you’re interested in working with Build Grow Scale or learning more about what we do, go to workwithbgs.com to schedule a free strategy session with an expert from our team. We’d love to learn about you, your store, and come up with a plan to take your ecommerce business to the next level!


About the author
Irene Wanja
Irene, a skilled Revenue Optimization Specialist for Build Grow Scale, combines an unparalleled focus on user research and a deep understanding of the ecommerce customer journey to orchestrate optimal shopping experiences. With an uncanny knack for detecting and addressing customer pain points through meticulous user testing, she utilizes tools such as moderated user tests, heatmaps, scrollmaps, and clickmaps to fast-track improvements in user experience and usability. Her keen eye for detail aids in swiftly spotting potential issues and implementing solutions, all while working closely with store owners and applying her intricate comprehension of user interactions. Passionate about software and technology, Irene immerses herself in enhancing her clients' business clarity, efficiency, and user satisfaction. Even though the value of user experience doesn't conform to a conventional numerical scale, the tangible outcomes of her work—improved user experience, amplified retention rates, and reduced customer support issues—are testaments to her prowess. Beyond her revenue optimization skills, Irene is a skilled writer and copywriter. She weaves her profound insights into engaging prose, crafting content that not only resonates with diverse audiences but also demystifies the complexities of user experience, consequently benefitting businesses worldwide.