

Ultimate Guide to Site Speed for 2022: Part 1 of 3
It’s common advice given to fresh store owners to keep their page loading quickly, but the actual mechanics of measuring and maintaining page speed are generally glossed over, waving vaguely to various tools. This may be for good reason, as the specifics do get rather technical quickly and require a fairly talented developer to handle for best results.
However, understanding more of how it all works can be beneficial to UX designers and store owners alike. Here we will go over how to properly measure site speed, identify the primary drivers of slowly loading pages, and even fix some of those issues.
While we have discussed this topic a few times in past blog posts and podcast episodes, I’m here to present to you the ultimate guide to site speed for 2022!
Note: This article will speak from the context of a store running on Shopify. Though many aspects are conceptually transferable to stores running elsewhere, this article may gloss over some details important to, and emphasize details not important to, non-Shopify stores.
The Benchmark
So, what is a good page speed? And what’s the cost of going over that speed?
A great benchmark to start from is that every second of load time over three seconds is costing 7% of potential conversions.
From here we can easily calculate the benefits of improving page speed.
For example, if we have a store making $100,000 in revenue in a month, with a page speed of 5.4 seconds, the equation would look like this:
$100,000 ∗ 1.07(5.4−3) – 100,000 = $17,600
The costs of slow loading pages can really add up quickly, but keep in mind that it is unlikely that your page loading time is the major block between your store and success. Like many aspects of Revenue Optimization™, this is just another bump to smooth out, where incremental gains in many places snowball. Page speed is not worth obsessing over to the point where obvious user experience improvements are refused because of small page slowing.
How to Measure Page Speed
So, sure, three seconds is great and all … But how do we even measure this? Every site speed tool anyone can recommend comes back with all kinds of different information, and possibly dozens of timers showing different measurements.
Unfortunately, there is no perfect single measurement of site speed to use, so the most important thing is being consistent in your own measuring to see if there are improvements overtime or not.
Before we get into all the different metrics, what they mean, and what good values are, let’s run an actual site speed test so we can go over this together. We’ll do our test on the store Fashion Nova.
While Fashion Nova does have room for improvement and some easy fixes to make, this can also illustrate that these page speed metrics are not the end all be all of ecommerce success. Being the highest-grossing Shopify store, Fashion Nova obviously has users that will push through less-than-perfect experiences to complete purchases. But that doesn’t mean they can have the slowest site in existence either.

Note: Since I initially tested this site in May 2021, Fashion Nova has gotten nearly 20% slower across the board.
WebPageTest
This tool is my favorite (yes, I’m the kind of nerd that has a favorite site speed tool), as well as the most recommended by industry insiders. It is run by an ex-Googler and designed particularly for developers. However, it can still offer many valuable insights to non-coders. Many other tools exist to try to make this more accessible, but they often leave off a lot of helpful aspects that WebPageTest just gets right.
Most importantly, it has easy settings that match the Google standards behind Lighthouse (the system behind PageSpeed Insights and Core Web Vitals), which can impact search engine ranking. Many other tools mask the meaning of the different settings they’re using and often do not comply with these standards.
Settings to Use
Let’s start by entering “https://www.fashionnova.com” right there in the test URL, and then take a look at the settings. You can, of course, use your own site as a reference instead.
These are the settings I recommend for getting results that will provide some real insights:
- Location: “London” //choose server nearby to main customer base
- Browser: “Chrome”
- Advanced Settings:
- Connection: “3G Fast (1.6Mbps,756Kbps 150ms RTT” //85% Mobile Connection
Tests to Run: 3 //Three Minimum - Repeat View: “First View and Repeat View” //compare first visit with
cached experience Capture Video: Y //Just do it. - Chromium: Emulate Mobile Browser: “Samsung Galaxy S8” //iPhone or S8
- Capture Devtools Timeline: Y
Most of these details are just to refine the test, but key things are the connection throttling and emulating a mobile browser.
Google Lighthouse uses an automatic connection throttling that matches in spec to WebPageTest’s 3G Fast setting. This slows the test down to match the internet connection that 85% of mobile connections perform better than. This will most likely be worse than your average user, but we’ll go over that later.
This level of throttling is also used by Core Web Vitals for SEO rankings, and is even then used by Shopify for their little Page Speed widget in the Shopify Dashboard. It’s fairly safe to say that this is the standard for site speed tests.
Emulating a mobile browser is also especially important in this era of mobile-first design. It’s almost a guarantee that the bulk of your sales come from users on their phones. This may be more even if you sell high-priced items that require more significant thought and evaluation, but focusing on the mobile experience is a requirement in 2022, not a suggestion.
Whether you pick Android or iOS is of little concern, as this is simply about screen dimensions and not support or functionality.
This may take a little while to complete, so sit back.
After the test, you’ll end up on a page that looks like this:
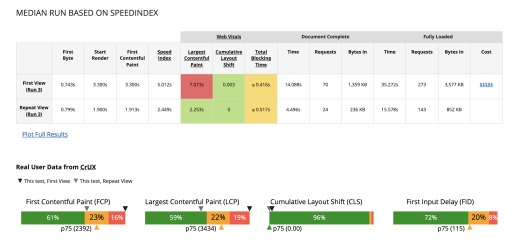
Results
Fashion Nova is doing kind of OK. Not “fantastic” … but “OK.”
The key metrics to pay attention to are the following:
| METRIC | VALUE |
| Start Render | 3.3s |
| First Contentful Paint | 3.3s |
| Speed Index | 5.012 s |
| Total Blocking Time | >416 ms |
| Fully Loaded Bytes In | 3,577 KB |
These all communicate different things about the site, and we’ll go over these and some others in Part 2 of this article series.
In the meantime, you can do this on a few different critical pages of your site to see if there are any standout pages that perform poorly. Note: Your collections pages will likely be a bit slower than other pages.
Wrap-up
Unfortunately, much of the fixes to these issues can’t be done without some more serious development skills, but hopefully, the articles in this guide (this one and those to come) will provide you with some additional context to help evaluate how dire your site speed situation is and present some paths forward.
Namely, site speed is important but not paramount, provided your site is generally functional. If you work regular speed tests into your process, you can see if/when changes can impact this aspect of the user experience and make more informed decisions about the need for development work.
As your store grows, the need to have a more consistent relationship with a developer will grow as well.


About the author
Eric Kwoka
Eric Kwoka is currently a BGS Revenue Optimizer and Coach for the Store Audit Team. He has a history of service with the United States Marine Corps and is learning while traveling the world with minimal adult supervision. He once committed to a multi-day horseback ride through the Tien Shan (Celestial) Mountains in Kyrgyzstan, despite never having rode a horse before.