

Ecom Tip: Use Comparison Charts to Help Your Store Visitors

Hey, everyone! Joe from Build Grow Scale here. I’m a Revenue Optimization™ expert, and I help ecommerce stores build, grow, and scale their businesses. In this training, I’m going to talk about how to help your store’s visitors choose products through comparison charts. So, let’s get into it!
Why comparison charts?
Comparison charts are tables you can present on your website that help visitors make better decisions about the products you sell.
A couple days ago, I was trying to find a new hair clipper so I can cut my own hair and look sharp every two weeks. I went to this website trying to find a better product than the one I currently have, which takes eight hours to fully charge and only has a battery life of about 40 minutes. It takes longer than that for one haircut! I needed a better option.
While shopping online, I couldn’t find any product filters to narrow down search results based on battery runtime. Different clippers have all kinds of different features and other specs, and I found myself wishing that there was a comparison chart to help me quickly analyze the info, weigh my options, and confidently make a final decision.
Side note: If you sell any tech-related products, comparison charts are extremely important. The relevant technical specs associated with those types of items—and there are a lot—play a huge role in which product a customer purchases.
Follow Apple’s example
Apple is a prime example of a store whose use of comparison charts every ecommerce business owner should emulate. When you go to the iMac category on their site, they have “Which iMac is right for you?” in big bold letters, and if you click on “Compare all Mac models” underneath that, you’ll see a big, beautiful chart with all kinds of information to compare (see below).
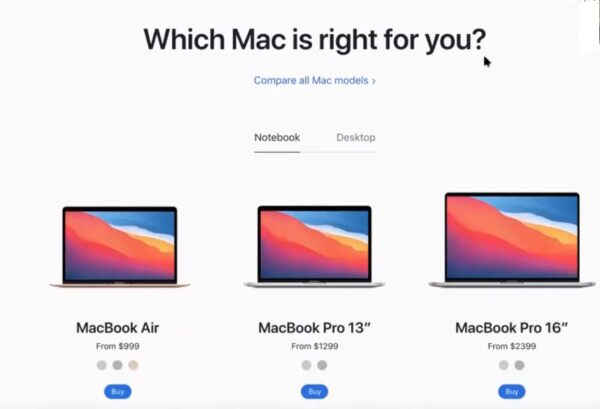
Here you can see a bird’s-eye view of the different Mac models and how they compare with each other when it comes to things like screen size, price, memory, storage, processor, etc.
So, if you have two or more products that are similar enough to compare and distinguish between, especially if they’re tech-type products (although they can be anything) … Instead of forcing users to open multiple tabs, go to each individual product page, and toggle back and forth between them to try to figure out how they’re different and which one is best for them, provide a comparison chart! The quicker, easier, and more stress-free you make shopping your store, the more likely people are to buy from you. It’s that simple.
How to create a comparison chart
Now that you know what comparison charts are and better understand their importance for both you and your customers, let’s talk about how to go about creating them for your own products.
Find out what matters to your customers
There are a couple great methods for determining what your customers care about in terms of the merchandise you sell, and you can employ one or both.
The first is looking through your product reviews. What are customers saying? Are they commenting on battery life, price, how quiet something is when running, size (how much room it takes up in their home), material durability, charging cord length?
The second, and this may seem obvious … is to just ask them! Sending out post-purchase surveys to people who have bought from you is an awesome way to get valuable feedback that can improve your business in a myriad of ways.
Pro tip: Give people an incentive, like 10% off their next purchase, so they’ll be more likely to participate.
However you collect your information, once you have it, create a visual that clearly shows people your product has the features they care about the most.
Contrast with the competition
You’ve seen this one a thousand times. And for good reason (it works). Creating a chart that shows how what you’re selling stacks up against the competition is a prime way to highlight your product’s best features and help tip the scales in your favor.
Listing out the important specs and using check marks to call out what your product has that the other guy is missing is a very common way to do that. Just make sure your chart is clean, concise, and easy to understand.
Quick recap
- If you sell multiple items that are difficult to differentiate between because of their similarity or similar uses, create a comparison chart to highlight the pros of what you’re selling and help users make a quicker, easier decision.
- Use product reviews and/or post-purchase surveys to find out what features matter most to your customers when it comes to the product you sell, and use that information to visually call out the fact that your product checks those boxes.
- Create a chart that shows how your product compares to (and is better than) the competition’s.
Wrap-up
That’s it for this training! I hope you enjoyed what I’ve shared and that you implement it on your ecom store in the near future. And remember … Anything you can do to reduce cognitive load and minimize stress, time, and energy for your customers is going to go a long way in securing the sale.
If you’re interested in learning more about what Build Grow Scale does or would like to hop on a free strategy session call with one of our Revenue Optimization™ experts, go to workwithbgs.com.


About the author
Joseph Liu
Joseph is laser focused on perfecting product pages and picks up new ideas lightning fast. He dissects, tests, and optimizes. He is also the man behind BGS marketing efforts. When he’s not cooking up good websites, you can find him in a CrossFit gym working out with his friend Travis.